Pyramid of energy or rule 10. Pyramid of numbers. To build a population pyramid, count the number of organisms in a certain area, grouping them by trophic levels
Lindemann's rule (10%)
The through flow of energy, passing through the trophic levels of the biocenosis, is gradually extinguished. In 1942, R. Lindeman formulated the law of the pyramid of energies, or the law (rule) of 10%, according to which from one trophic level of the ecological pyramid moves to another, higher level (along the “ladder”: producer - consumer - decomposer) on average about 10% of the energy received at the previous level of the ecological pyramid. The reverse flow associated with the consumption of substances and energy produced by the upper level of the ecological pyramid by its lower levels, for example, from animals to plants, is much weaker - no more than 0.5% (even 0.25%) of its total flow, and therefore we can say there is no need to talk about the energy cycle in the biocenosis.
If energy is lost tenfold during the transition to a higher level of the ecological pyramid, then the accumulation of a number of substances, including toxic and radioactive ones, increases in approximately the same proportion. This fact is fixed in the rule of biological enhancement. It is true for all cenoses. In aquatic biocenoses, the accumulation of many toxic substances, including organochlorine pesticides, correlates with the mass of fats (lipids), i.e. clearly has an energetic basis.
Ecological pyramids
To clearly represent the relationships between organisms of different species in a biocenosis, it is customary to use ecological pyramids, distinguishing pyramids of numbers, biomass and energy.
Among the ecological pyramids, the most famous and frequently used are:
§ Pyramid of numbers
§ Pyramid of biomass
Pyramid of numbers. To build a population pyramid, the number of organisms in a certain territory is counted, grouping them by trophic levels:
§ producers - green plants;
§ primary consumers are herbivores;
§ secondary consumers - carnivores;
§ tertiary consumers - carnivores;
§ ga-e consumers (“ultimate predators”) - carnivores;
§ decomposers - destructors.
Each level is depicted conventionally as a rectangle, the length or area of which corresponds to the numerical value of the number of individuals. By arranging these rectangles in a subordinate sequence, we obtain an ecological pyramid of numbers (Fig. 3), the basic principle of which was first formulated by the American ecologist C. Elton Nikolaikin N. I. Ecology: Textbook. for universities / N. I. Nikolaikin, N. E. Nikolaikina, O. P. Melekhova. - 3rd ed., stereotype. - M.: Bustard, 2004..
Rice. 3. Ecological population pyramid for a meadow overgrown with cereals: numbers - number of individuals
Data for population pyramids are obtained fairly easily by direct sample collection, but there are some difficulties:
§ Producers vary greatly in size, although one specimen of grass or algae has the same status as one tree. This sometimes disrupts the correct pyramidal shape, sometimes even giving inverted pyramids (Fig. 4) Ibid.;

Rice.
§ The range of abundance of different species is so wide that it makes it difficult to maintain scale when depicting graphically, but in such cases a logarithmic scale can be used.
Biomass pyramid. The ecological pyramid of biomass is built similarly to the pyramid of numbers. Its main meaning is to show the amount of living matter (biomass - the total mass of organisms) at each trophic level. This avoids the inconveniences typical of population pyramids. In this case, the size of the rectangles is proportional to the mass of living matter of the corresponding level, per unit area or volume (Fig. 5, a, b) Nikolaikin N. I. Ecology: Textbook. for universities / N. I. Nikolaikin, N. E. Nikolaikina, O. P. Melekhova. - 3rd ed., stereotype. - M.: Bustard, 2004.. The term “biomass pyramid” arose due to the fact that in the vast majority of cases the mass of primary consumers living at the expense of producers is significantly less than the mass of these producers, and the mass of secondary consumers is significantly less than the mass of primary consumers. Biomass of destructors is usually shown separately.

Rice. 5. Pyramids of biomass of biocenoses of a coral reef (a) and the English Channel (b): numbers - biomass in grams of dry matter per 1 m 2
When sampling, standing biomass or standing yield (i.e., at a given point in time) is determined, which does not contain any information about the rate of biomass production or consumption.
The rate of creation of organic matter does not determine its total reserves, i.e. the total biomass of all organisms at each trophic level. Therefore, errors may occur during further analysis if the following are not taken into account:
* firstly, if the rate of biomass consumption (loss due to consumption) and the rate of its formation are equal, the standing crop does not indicate productivity, i.e. about the amount of energy and matter moving from one trophic level to another, higher one, over a certain period of time (for example, a year). Thus, on a fertile, intensively used pasture, the yield of standing grass may be lower, but the productivity may be higher than on a less fertile, but little used for grazing;
* secondly, small-sized producers, such as algae, are characterized by a high rate of growth and reproduction, balanced by their intensive consumption as food by other organisms and natural death. Therefore, their productivity may be no less than that of large producers (for example, trees), although the standing biomass may be small. In other words, phytoplankton with the same productivity as a tree will have much less biomass, although it could support the life of animals of the same mass.
One of the consequences of this is “inverted pyramids” (Fig. 3, b). Zooplankton of biocenoses of lakes and seas most often have greater biomass than their food - phytoplankton, but the rate of reproduction of green algae is so high that within 24 hours they restore all the biomass eaten by zooplankton. Nevertheless, at certain periods of the year (during spring flowering) the usual ratio of their biomass is observed (Fig. 6) Nikolaikin N.I. Ecology: Textbook. for universities / N. I. Nikolaikin, N. E. Nikolaikina, O. P. Melekhova. - 3rd ed., stereotype. - M.: Bustard, 2004..

Rice. 6. Seasonal changes in the pyramids of lake biomass (using the example of one of the lakes in Italy): numbers - biomass in grams of dry matter per 1 m3
The energy pyramids discussed below are devoid of apparent anomalies.
Pyramid of energies. The most fundamental way to reflect the connections between organisms of different trophic levels and the functional organization of biocenoses is the energy pyramid, in which the size of the rectangles is proportional to the energy equivalent per unit time, i.e. the amount of energy (per unit area or volume) that passed through a certain trophic level over a given period (Fig. 7) Ibid.. To the base of the energy pyramid, one more rectangle can be reasonably added from below, reflecting the flow of solar energy.
The energy pyramid reflects the dynamics of the passage of food mass through the food (trophic) chain, which fundamentally distinguishes it from the pyramids of numbers and biomass, which reflect the statics of the system (the number of organisms at a given moment). The shape of this pyramid is not affected by changes in the size and metabolic rate of individuals. If all energy sources are taken into account, then the pyramid will always have a typical appearance (in the form of a pyramid with the top up), according to the second law of thermodynamics.

Rice. 7. Energy pyramid: numbers - amount of energy, kJ * m -2 * r -1
Energy pyramids make it possible not only to compare different biocenoses, but also to identify the relative importance of populations within one community. They are the most useful of the three types of ecological pyramids, but the data to construct them are the most difficult to obtain.
One of the most successful and clear examples of classical ecological pyramids are the pyramids shown in Fig. 8 Nikolaikin N.I. Ecology: Textbook. for universities / N. I. Nikolaikin, N. E. Nikolaikina, O. P. Melekhova. - 3rd ed., stereotype. - M.: Bustard, 2004. They illustrate the conditional biocenosis proposed by the American ecologist Yu. Odum. The "biocenosis" consists of a boy who eats only veal, and calves who eat only alfalfa.

Rice.
Rule 1% Ecology. Lecture course. Compiled by: Ph.D., Associate Professor A.I. Tikhonov, 2002. Pasteur’s points, like R. Lindemann’s law of the energy pyramid, gave rise to the formulation of the rules of one and ten percent. Of course, 1 and 10 are approximate numbers: about 1 and about 10.
"Magic number" 1% arises from the ratio of energy consumption possibilities and the “capacity” required to stabilize the environment. For the biosphere, the share of possible consumption of total primary production does not exceed 1% (which follows from R. Lindemann’s law: about 1% of net primary production in energy terms is consumed by vertebrates as consumers of higher orders, about 10% by invertebrates as consumers of lower orders, and the remaining part - bacteria and saprophagous fungi). As soon as humanity, on the verge of the last and our centuries, began to use a larger amount of biosphere products (now at least 10%), the Le Chatelier-Brown principle ceased to be satisfied (apparently, from about 0.5% of the total energy of the biosphere): vegetation did not provide biomass growth in accordance with the increase in CO 2 concentration, etc. (an increase in the amount of carbon fixed by plants was observed only in the last century).
Empirically, the threshold of consumption of 5 - 10% of the amount of substance, which leads to noticeable changes in the systems of nature when passing through it, is sufficiently recognized. It was adopted mainly on an empirical-intuitive level, without distinguishing the forms and nature of control in these systems. It is roughly possible to divide the emerging transitions for natural systems with organismic and consortium types of management on the one hand, and population systems on the other. For the former, the values we are interested in are the threshold for exiting a stationary state of up to 1% of the energy flow (“norm” of consumption) and the threshold of self-destruction – about 10% of this “norm”. For population systems, exceeding an average of 10% of the volume of withdrawal leads to the exit of these systems from the stationary state.
VPR All-Russian Test Work - Biology, grade 11
Explanations for the sample of the All-Russian test work
When familiarizing yourself with a sample test work, you should keep in mind that the tasks included in the sample do not reflect all the skills and content issues that will be tested as part of the all-Russian test work. A complete list of content elements and skills that can be tested in work is given in the codifier of content elements and level requirements
training graduates for the development of an all-Russian test in biology.
The purpose of the sample test work is to give an idea of the structure of the all-Russian test work, the number and form of tasks, and their level of complexity.
Instructions for performing the work
The test includes 16 tasks. 1 hour 30 minutes (90 minutes) is allotted to complete the biology work.
Write down answers to assignments in the space provided for this in your work. If you write down an incorrect answer, cross it out and write a new one next to it.
You are allowed to use a calculator when doing work.
When completing assignments, you can use a draft. Entries in draft will not be reviewed or graded.
We advise you to complete the tasks in the order in which they are given. To save time, skip a task that you cannot complete immediately and move on to the next one. If you have time left after completing all the work, you can return to the missed tasks.
The points you receive for completed tasks are summed up. Try to complete as many tasks as possible and score the most points.
We wish you success!
1. Select from the given list of systematic taxa three taxon that are general when describing the depicted organisms.
List of taxa:
1) class Dicotyledons
2) Empire Noncellular
3) the kingdom of Prokaryotes
4) kingdom of Plants
5) subkingdom Multicellular
6) Flower department
Record the numbers of the selected taxa.
All plants existing on our planet are combined into one kingdom which is called Plants.
Plants are divided into two subkingdoms - higher and lower.
Lower plants include algae.
And higher plants are divided into Spore and Seed plants. The spore divisions include Mosses, Horsetails, Mosses and Ferns. And for the seed plants - the Gymnosperm department and the Angiosperm (Flower) department.
Gymnosperms do not have herbaceous forms, and since we see that the plants given to us are definitely not trees or shrubs, they belong to Department Flowering(the same conclusion could be drawn from the presence of flowers and fruits).
Cabbage is a plant of the Cruciferous (Cabbage) family, peas belong to the Legume family, and potatoes belong to the Solanaceae family. Plants of these families belong to class Dicotyledons.
Thus, the correct answers are points 1 , 4 , 6 .
Let's eliminate the other answer options.
These plants are not classified as non-cellular plants, since they have a cellular structure, that is, they consist of cells. They are not classified as a superkingdom of Prokaryotes, since prokaryotes are organisms that do not have a nucleus in their cells, while plants do have a nucleus. They do not belong to the subkingdom Multicellular, since in the taxonomy of plants there are subkingdoms Higher and Lower, but there are no subkingdoms Multicellular at all.
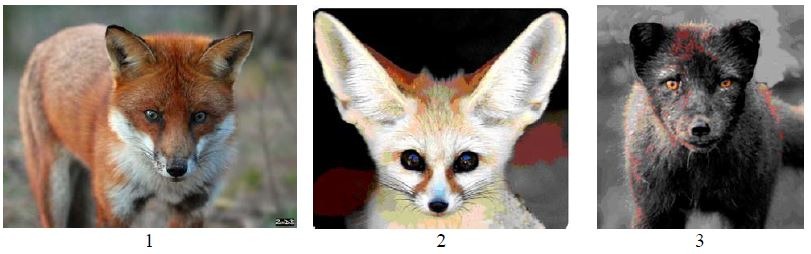
2. Allen's rule states that among related forms of warm-blooded animals, leading a similar lifestyle, those that live in colder climates have relatively smaller protruding body parts: ears, legs, tails, etc.
Look at the photographs showing representatives of three closely related species of mammals. Arrange these animals in the sequence in which their natural habitats are located on the surface of the Earth from north to south.
1. Write down in the table the corresponding sequence of numbers that indicate
photos.
2. Using your knowledge of thermoregulation, explain Allen's rule.
________________________________________________________________________________
Answer to the first question: 312
The answer to the second question: the larger the body surface of a warm-blooded animal, the more intense the heat transfer. Large ears contribute to this.
Answering the first question is not at all difficult. It is worth considering that it is necessary to arrange the animals starting from the northernmost, and according to Allen’s rule, northern animals have smaller protruding body parts. This means we must arrange the animals, starting with the one that has the smallest ears.
A decrease in the protruding parts of the body in animals leads to a decrease in the surface of the body, and therefore to a decrease in heat transfer. This helps animals living in cold conditions save heat. The answer to the second question should be based on this.
1. Sort organisms according to their position in the food chain.
Write in each cell
the name of one of the proposed organisms.
List of organisms: grasshoppers, plants, snakes, frogs, eagle.
food chain
2. The rule says:“no more than 10% of the energy comes from each previous trophic level to the next.” Using this rule, calculate the amount of energy (in kJ) that goes to the level of second-order consumers when the net annual primary production of the ecosystem is 10,000 kJ.
1. plants – grasshoppers – frogs – snakes – eagle
4. Study the drawing. Through what process was such a variety of organisms depicted formed?

Answer: __________________________________________________________________________
Artificial selection
OR mutational variability,
OR hereditary variability
5. Study the graph showing the dependence of the rate of reaction catalyzed by the enzyme, on the dog’s body temperature (the x-axis is the dog’s body temperature (in °C), and the y-axis is the rate of the chemical reaction (in arbitrary units)).

It is known that the body temperature of a healthy dog is in the range of 37.5–38.5 °C. How will the rate of chemical reactions in a dog’s body change if its body temperature is higher than normal?
Answer: __________________________________________________________________________
The rate of chemical reactions will decrease (fall)
6. Fill in the blank cells of the table using the list of missing elements below: for each gap indicated by a letter, select and write down the number of the required element in the table.
Missing elements:
1) DNA
2) anatomy
3) organismic
4) chloroplast
5) molecular genetic
6) cytology
7. Cholesterol plays an important role in metabolism and the functioning of the nervous system. It enters the body from animal products. It is practically absent in plant products. The amount of cholesterol entering the body with food should not exceed 0.3–0.5 g per day.
1. Using the table data, calculate the amount of cholesterol in the breakfast of a person who ate 100 g of low-fat cottage cheese, 25 g of “Dutch” cheese, 20 g of butter and two sausages.

Answer: _________________________________________________________________________.
2. What danger does excess cholesterol in the human body pose to human health?
Answer: __________________________________________________________________________
________________________________________________________________________________
________________________________________________________________________________
2. damage to blood vessels,
OR development of atherosclerosis,
OR coronary heart disease
8. Sergei came to the doctor because he was feeling unwell. The doctor gave him a referral for analysis, the results of which showed that the number of leukocytes was 2.5 × 10⁸, while the norm is 4–9 × 10⁹. What test did the doctor suggest you take and what diagnosis did he make based on the results obtained? Select the answers from the following list and write their numbers in the table.
List of answers:
1) carbohydrate metabolism disorder
2) oxygen deficiency
3) blood test
4) decreased immunity
5) stool analysis
9. Determine the origin of the diseases listed. Write down the number of each
diseases in the list into the corresponding table cell. Table cells may contain
Several numbers have been recorded.
List of human diseases:
1) chicken pox
2) Down syndrome
3) myocardial infarction
4) dysentery
5) malaria
| 2 | 145 | 3 |
10. The genealogical method is widely used in medical genetics. It is based on compiling a person’s pedigree and studying the inheritance of a particular trait. In such studies, certain notations are used. Study a fragment of the family tree of one family, some of whose members are deaf and dumb.
Fragment of the family tree

Using the proposed diagram, determine:
1) this trait is dominant or recessive;
2) this trait is not linked or linked to sex chromosomes.
Answer:
1)______________________________________________________________________________;
2)______________________________________________________________________________
- recessive trait
2. the trait is not sex-linked
11. Sveta always wanted to have the same “dimples” on her cheeks as her mother (dominant trait (A) is not gender-linked). But Sveta did not have dimples, like her father. Determine the genotypes of family members based on the presence or absence of dimples. Enter your answers in the table.
| Mother | Father | Daughter |
Mother - Aa; father - aa; daughter - ah
12. The court considered a claim to establish the paternity of the child. A blood test was done on the child and his mother. In the child it turned out to be II(A), and in the mother it was I(0). Analyze
table data and answer the questions.

1. The child’s mother stated in court that the father of her son is a man with group IV (AB)
blood. Could he be the child's father?
2. Based on the rules of blood transfusion, decide whether the child can be a donor
blood for his mother.

Answer: __________________________________________________________________________
3. Using the data from the table “Blood groups according to the AB0 system”, explain your decision.

*Note.
An antigen is any substance that the body views as foreign or potentially dangerous and against which it usually begins to produce its own antibodies.
Antibodies are blood plasma proteins formed in response to the introduction of bacteria, viruses, protein toxins and other antigens into the human body.
Answer: __________________________________________________________________________
________________________________________________________________________________
________________________________________________________________________________
Answer to the first question: yes
Answer to the second question: no
The answer to the third question: as a result of simultaneously being in
mother's bloodstream, during transfusion, of the same antigens A
of the child and α antibodies (mother) the erythrocytes will stick together, which
can lead to the death of the mother
13. The nucleotide composition of a fragment of a wheat DNA molecule was studied in a biochemical laboratory. It was found that the proportion of adenine nucleotides in the sample was 10%.
Using Chargaff's rule, which describes the quantitative relationships between different types of nitrogenous bases in DNA (G + T = A + C), calculate the percentage of nucleotides with cytosine in this sample.
Answer: ______________

1. Consider an image of a double-membrane organelle of a eukaryotic cell. What is it called?
Answer:___________________________
2. What process will be disrupted in the cell in the event of damage (disturbances in the functioning) of these organelles?
Answer: _________________________________________
1. mitochondria
2. energy metabolism,
OR the breathing process,
OR biological oxidation
15. The genetic code is a method characteristic of all living organisms encoding the sequence of amino acid residues in proteins using
sequences of nucleotides in a nucleic acid.
Study the genetic code table, which demonstrates the correspondence of amino acid residues to the composition of codons. Using the amino acid serine (Ser) as an example, explain the following property of the genetic code: the code is triplet.
Genetic code table

Answer: __________________________________________________________________________
________________________________________________________________________________
________________________________________________________________________________
1) each amino acid corresponds to a combination of three nucleotides
(triplets, codons);
2) coding of the amino acid serine (Ser) can occur with
using one of the following codons (triplets): TCT, TCT,
TCA, TCG, AGT, AGC
16. The picture shows Archeopteryx, an extinct animal that lived 150–147 million years ago.

Using a fragment of a geochronological table, establish the era and period in which
inhabited by this organism, as well as its possible ancestor at the class level (superorder)
animals.

Era: ______________________________________________________________
Period:___________________________________________________________
Possible ancestor:_________________________________________________
Era: Mesozoic era;
Period: Jurassic;
Possible ancestor: ancient reptiles, OR
reptiles OR reptiles OR dinosaurs
© 2017 Federal Service for Supervision in Education and Science of the Russian Federation
The discipline “Ecology” examines the principles of managing natural and natural-anthropogenic systems in the process of environmental management in order to ensure the sustainable development of these systems. To do this, first of all, it is necessary to know and take into account the rules, principles and laws of the functioning of the biosphere.
Rules
The one percent rule. According to the one percent rule, a change in the energy of a natural system within 1% (from a few tenths to, as an exception, a few percent) takes the natural system out of an equilibrium (quasi-stationary) state. All large-scale phenomena on the Earth's surface (powerful cyclones, volcanic eruptions, the process of global photosynthesis), as a rule, have a total energy that does not exceed 1% of the energy of solar radiation incident on the surface of our planet. The transition of the process energy beyond this value (1%) usually leads to significant anomalies: sharp climatic deviations, changes in the nature of vegetation, large forest and steppe fires.
Note. The One Percent Rule is of particular importance for global systems. Their energy, apparently, fundamentally cannot exceed the level of approximately 0.2% of incoming solar radiation (the energy level of photosynthesis) without catastrophic consequences. This is probably an insurmountable threshold and limit for humanity (from which “nuclear winter” follows).
The Ten Percent Rule (Law of the Pyramid of Energy) . In accordance with the law of the energy pyramid, on average no more than 10% of energy moves from one trophic level of the ecological pyramid to another level. The law of the energy pyramid allows you to make calculations of the required land area to provide the population with food and other environmental and economic calculations.
The average maximum transfer of energy (or matter in energy terms) from one trophic level of the ecological pyramid to another is 10% (10% rule); it can range from 7 to 17%. This value does not lead to adverse consequences for the ecosystem and therefore can be accepted as the norm for environmental management in human economic activity. Exceeding this value is unacceptable, since in this case
complete extinctions of populations may occur. The law of the energy pyramid and the ten percent rule serve as a general limitation in the use of natural resources for human economic activity.
The rule of mandatory filling of ecological niches. An empty ecological niche is always naturally filled. An ecological niche as a functional place of a species in an ecosystem allows a form capable of developing adaptive characteristics to fill this niche, but sometimes this requires considerable time.
Often, so-called ecological niches are just an optical illusion (for specialists). In reality, ecological niches are sometimes filled in the most unexpected ways.
In connection with the possibility of the existence of pseudo-empty ecological niches, one should never rush to conclusions about the possibility of filling these niches through acclimatization of species, since acclimatization and re-acclimatization work will be effective only if there are actually free ecological niches, which is extremely rare.
Note. A likely example of the rule of mandatory filling of ecological niches is the emergence of new diseases, for example, AIDS (acquired immunodeficiency syndrome). It was hypothetically predicted more than 10 years before the disease was identified as an influenza-like virus with a high mortality rate. The basis for the prediction was that the victory over many human infectious diseases freed up ecological niches that inevitably had to be filled. Since during ecological duplication, as a rule, the change goes in the direction from larger and highly organized forms to smaller and more organized ones, it was assumed that one of the ecological niches would be filled precisely by a virus with a high degree of variability. The influenza virus has a mutation rate of 1:10 5 with an average normal process frequency of 1:10 6 . The AIDS virus is even more variable - it has a mutation rate of 1:10 4 . Thus, the hypothesis was apparently justified.
The rule of inevitable chain reactions (“hard” control of nature). “Hard” technical management of natural systems and processes is fraught with natural chain reactions, a significant part of which is environmentally, socially and economically unacceptable over a long period of time. An example with the Aral disaster. The transfer of water from northern rivers would lead to undesirable environmental effects (flooding of a huge area of land, destruction of forest, oil, gas fields, etc.)
The rule of “soft” management of nature. “Soft” (indirect) control of nature causes chain reactions desirable for humans.
“Soft” control is more preferable than a “hard” technogenic solution, despite the high initial costs. This is the rule for the expedient transformation of nature. In contrast to “hard” management (see the Rule of chain reactions under “hard” management), “soft” management, based on restoring the former natural productivity of ecosystems or increasing it through a purposeful series of events based on the use of objective laws of nature, makes it possible to direct natural chain reactions reactions in a direction favorable for the economy and people’s lives. An example is the comparison of two forms of forestry management – clear-cutting (“hard” impact) and selective logging (“soft” impact). Clear cutting, in which all the wood is taken in one go, is considered economically more profitable. When selective cutting occurs, many technical complications arise, and therefore the cost of wood harvesting turns out to be more expensive. It is assumed that in clear cutting areas the forest can and should be restored by mass planting (and this activity is generally inexpensive). However, with clear cuttings, the forest environment itself is gradually lost, which leads to a drop in river levels, in other places - to waterlogging, overgrowing of the cutting area with non-forest plant species, preventing forest growth, the emergence of breeding grounds for forest pests, and other adverse consequences. The lower initial costs of a “hard” event give rise to a chain of damages, which then require large expenses for their elimination. On the contrary, with selective logging, forest restoration is facilitated due to the preservation of the forest environment. The increased initial costs are gradually recouped by preventing environmental damage.
The transition from “soft” to “hard” management is advisable only with the simultaneous replacement of extensive forms of farming with extremely intensive ones and, as a rule, within relatively short time intervals. In the long term, only “soft” control of natural processes is effective. See also Principles of Nature Transformation.
Rule “Ecologically-economical”. Economics and ecology cannot be opposed. You cannot slow down the pace of industrialization - this will mean a kind of economic utopianism, just as you cannot reduce your efforts in the field of ecology - this will mean environmental extremism. The solution to the issue lies somewhere in the middle.
Rule of economic-ecological perception. We cannot mean that the number of degrees of freedom in the actions of our descendants will decrease rather than increase. We live on credit from our grandchildren. Descendants will pay very dearly for nature's bills, much more than we pay.
The rule of basal metabolism, about the advantage of spending matter and energy on the self-maintenance of the system. The ratio between basal metabolism and useful work in the human economy can be improved to a certain extent, like any efficiency. For mechanical systems it can be very high, although it never reaches 100%; the efficiency of complex dynamic systems can only reach relatively high values for a short time, but not more than 30%. The rest goes to internal exchange, otherwise the systems themselves would not exist. Long-lived large-scale ecosystems cannot be equated with short-lived mechanical systems. In living systems, a lot of “fuel” is spent on “repairs” for self-maintenance and self-regulation, and when calculating the efficiency of engines, energy costs for repairs, etc. are not taken into account.
Integral resource rule. Competing in the field of use specific natural systems of economic sectors inevitably cause damage to each other the more strongly, the more significantly they change the jointly exploited ecologicalcomponent or all ecosystem generally. The integral resource rule is another applied consequence of the law of internal dynamic equilibrium. For example, in the water sector, hydropower, transport, public utilities, irrigated agriculture and the fishing industry are interconnected in such a way that fisheries are in the least advantageous position. The more complete the hydropower use of water, the more difficult it is to manage other sectors of the water economy: the development of water transport complicates other methods of water use, and irrigation causes difficulties in related forms of water exploitation.
Rule of demographic saturation. In a global or regionally isolated population, the population size corresponds to the maximum ability to support its life activity, including all aspects of existing human needs.
In essence, this rule states that humans, like any other biological species, will increase their numbers to the maximum possible size, which is determined by the capacity of the environment, and no more. However, humanity creates pressure on the environment not so much biologically as technogenically. In fact, what is currently observed in the world is not demographic saturation, taking into account all human needs, but technical oversaturation.
Failure to comply with the demographic rule
saturation results in a sharp imbalance in the system of relationships “man-nature”. Theoretically, a situation is possible when limiting mechanisms are implemented and a demographic catastrophe occurs (a sharp decline in the human population). The rule of historical growth of production due to succession ecosystem rejuvenation. Since the net productivity of a community is maximum in the early stages of ecosystem development, the main source of production growth during the historical development of society was the successional rejuvenation of ecosystems.
(Succession is the replacement of one community of organisms (biocenoses) by others in a certain sequence).
The net productivity of the community (annual biomass growth) is high in the early stages of development and is practically zero in mature ecosystems. Initially, successionally mature ecosystems were the basis for gathering and hunting. From a certain point they begin to give way to production cenoses. In the latter, the yield of pure products is higher. Previously, as the population grew, the area of rejuvenated systems increased, an extensive way of developing agricultural production. Next, the following mechanism for increasing the productivity of the ecosystem is activated: the intensive path of development is an increase in the amount of energy invested in production. However, this mechanism is not unlimited. There comes a time when additional investment of energy into the agroecosystem leads to its destruction, as the energy limit is reached. The modern historical finale of this development is the transition to the exploitation of extremely rejuvenated ecosystems with a sharp jump in energy costs. Ecosystem methods of doping through successional rejuvenation are almost exhausted. further investment of anthropogenic energy in agriculture will lead to the destruction of natural structures, so other technologies will be required - more efficient and low-energy-intensive. The more rapidly a person’s environment and farming conditions change under the influence of anthropogenic factors, the sooner, according to the feedback principle, a change occurs in the socio-ecological properties of a person, the economic and technical development of society. This system tends to self-accelerate.
For example, in response to deteriorating indicators of the living environment caused by anthropogenic activities, mechanisms arise that seek to improve it (change of generations of technology, resource-saving knowledge-intensive production, demographic regulation). The only question is to what extent the acceleration of historical development will correspond in action to the rule of demographic saturation and the Le Chatelier-Brown principle.
So far, historical development is clearly lagging behind and this poses a danger to people’s well-being.
In accordance with the law of the pyramid of energies, On average, no more than 10% of energy moves from one trophic level of the ecological pyramid to another level- This ten percent rule. The law of the pyramid of energies allows one to make calculations of the required land area to provide the population with food and other environmental and economic calculations. The average maximum transfer of energy (or matter in energy terms) from one trophic level of the ecological pyramid to another, amounting to 10%, can fluctuate between 7-17%. Exceeding this value is unacceptable, otherwise complete disappearances of populations may occur.
The one percent rule -a change in the energy of a natural system within one percent removes the natural system from an equilibrium (quasi-stationary) state. Empirically, this rule is confirmed by studies of climate and other natural processes.
All large-scale phenomena on the Earth's surface (powerful cyclones, volcanic eruptions, the process of global photosynthesis), as a rule, have a total energy that does not exceed 1% of the energy of solar radiation incident on the surface of our planet. The transition of the process energy beyond this value usually leads to significant anomalies - sharp climatic deviations, changes in the nature of vegetation, large forest and steppe fires.
As with the ten percent rule, much depends on the state of the natural system in which the change occurs. This is what this rule does probable provides only guidelines that are advisable to follow or take into account a possible chain of events associated with the system’s exit from an equilibrium (quasi-stationary) state.
The rule of this percentage is of particular importance for global systems. Their energetics, it is assumed, fundamentally cannot exceed the level of approximately 0.2% of incoming solar radiation (the energy level of photosynthesis) without catastrophic consequences. This is probably an insurmountable and unacceptable threshold for humanity (from which “nuclear winter” follows).
Rice. 2. Thermal energy lost during breathing
Food chains that begin with photosynthetic organisms called chains of eating(pastoral, consumption chains).
Chains that begin with dead plant matter, carcasses, and animal excrement- detrital chains of decomposition.
Trophic chains are not isolated from each other; closely intertwined, they form food webs. Thanks to trophic connections in the ecosystem, the transformation of nutrients and the accumulation of energy occurs, with their subsequent distribution between species and populations. The richer the species composition, the more diverse the direction and speed of energy flows in the ecosystem.
Trophic food chains are based on the:
- the second law of thermodynamics, according to which some of the energy is dissipated and becomes unavailable for use in the form of thermal energy;
In ecosystems of different types, the power of energy flows through the chains of grazing and decomposition is different:
IN water communities part of the energy fixed by unicellular algae goes to animals feeding on phytoplankton, then to predators, and a smaller part is included in decomposition chains;
For the most part ecosystems sushi the opposite relationship is observed. Thus, in forests, more than 90% of the annual increase in plant mass enters the detritus chains through litter.
Number of links in the power circuit may vary, but basically there are usually from 3 to 5.
A set of organisms united by a certain type of nutrition, is called "trophic level". There are:
The first level, which is occupied autotrophs(producers);
Second - herbivores(consumers of the first order);
There may be more trophic levels when parasites living on consumers of previous levels are taken into account.
An example of a power circuit would be food chain of biological biocenosis.
For example, the chain begins with the capture of solar energy: a flower. The butterfly, feeding on the nectar of a flower, represents the second link in this chain. A dragonfly attacks a butterfly. And the hidden frog catches the dragonfly, but is itself prey for the snake, which in turn will be eaten by the hawk. The power circuit has closed. The potential (but not necessary) final link in the food chain is humans.
All the processes discussed above are associated with the synthesis and transformation of organic matter in trophic networks and characterize “pasture chains.”
"Detrital Chains" begin with the decomposition of dead organic matter by special groups of consumers - saprophages. Saprophages mechanically, and partly chemically, destroy dead organic matter, preparing it for the action of decomposers. In terrestrial ecosystems, this process (mostly) takes place in the litter and soil. Soil invertebrate animals (arthropods, worms) and microorganisms take an active part in the decomposition of dead organic matter. The process of destruction proceeds sequentially, saprophages change each other in accordance with the specifics of the species' nutrition. Mechanical destruction is carried out by large saprophages (for example, insects), and the mineralization process is carried out by other organisms (primarily bacteria and fungi).
Since saprophage communities are distinguished by relatively weak organizational rigidity, stochastic processes of saprophage formation take place in detrital chains, some of their species are easily replaced by other species, the role of external environmental factors and competitive exclusion is great (N.M. Chernova, N.A. Kuznetsova, 1986 ). That is, from the level of consumers, the flow of organic matter goes through different groups of consumers: living organic matter goes along “pasture chains”, and dead organic matter goes through “detritus chains”.
Ecosystem Productivity
Relationship between productivity and climatic characteristics. All organisms need matter to build their bodies, and energy to maintain their vital functions. Sunlight, carbon dioxide, water and mineral salts are the resources needed to create primary production. Temperature also has a significant influence on the rate of photosynthesis. The quality and quantity of light, the availability of water and nutrients, as well as temperature are very variable factors that can limit primary production.
Each square meter of the earth's surface receives from 0 to 5 J every minute solar energy. According to the spectral composition, only about 44% of the incident short-wave light is suitable for synthesis, and a significant proportion of solar energy is not available to plants. Coniferous forests have the highest efficiency in the use of solar energy: they convert 1-3% of physiologically active radiation (PAR) into biomass. Deciduous forests convert only 0.5-1% PAR into biomass, and deserts even less - 0.01-0 .02%. The maximum efficiency of photosynthesis of grain crops under ideal conditions does not exceed 3-10%.
The plant's use of available light improves slightly if it has a good supply of other resources.
Water - an irreplaceable resource both as a component of the cell and as a participant in photosynthesis. Therefore, productivity is always closely related to the amount of precipitation.
temperature environment. This dependence is complex.
The production of the terrestrial community also depends on content in the soil of various substances necessary for plants microelements. Nitrogen compounds have a particularly large effect. Moreover, their origin must be biological, that is, the result of nitrogen fixation by microorganisms, and not geological.
Productivity is also significantly affected by human activity. As agriculture develops in the direction of obtaining maximum production, the impact on nature caused by the redistribution of energy and substances on the Earth's surface is constantly increasing. The improvement of tools, the introduction of high-yielding crops and varieties that require large amounts of nutrients began to dramatically disrupt natural processes.
Destructive unsound agricultural practices and farming systems, which call:
Soil erosion and loss of fertile layer;
Salinization and waterlogging of irrigated areas;
Decrease in biological diversity of natural landscapes;
Contamination of surface and groundwater with residues of pesticides and nitrates;
The disappearance of wild animals as a result of the destruction of their habitats and much more.
To regulate and solve these problems, they offer scientifically based techniques and methods that, in certain cases, can only partially prevent or reduce undesirable effects that arise when obtaining primary biological products. In recent decades, environmental restrictions have been increasingly introduced.
There is an objective natural limit - threshold for reducing natural fertility, when approaching which, all human technical power becomes less effective. In the second half of the 20th century. There was a significant increase in primary biological production due to the introduction of new high-yielding varieties of grain crops, the use of large amounts of mineral fertilizers and the use of plant protection products. However, this indicator stopped growing, which was a reflection of the action law reducing the energy efficiency of environmental management.
But the human population continues to grow, and there is no more fertile land. Therefore, increasing the efficiency of green plants is the most pressing problem in solving the primary problems of human life support. In table 4, one of the options for calculating the primary production of the globe was carried out based on the results of P. Duvigneau’s research.
| Ecosystem | Surface, million km 2 | Photosynthesis yield, % | Productivity, t/ha | Total productivity of organic matter billion t/ha |
| Forests | 40,7 | 0,38 | 20,4 | |
| Steppes | 25,7 | 0,1 | 1,5 | 3,8 |
| Arable lands | 14,0 | 0,25 | 5,6 | |
| Deserts | 54,9 | 0,01 | 0,2 | 1,1 |
| Antarctica | 12,7 | |||
| Ocean | 0,05 | 0,8 | ||
| Total | 60,9 |
From the data in table. Figure 4 shows that the ocean ecosystem provides half of the planet's total production, forests - a third, and arable land (together with steppes) - about one tenth.
When calculating the secondary production of ecosystems, calculations are made separately for each trophic level, because when energy moves from one trophic level to another, it increases due to input from the previous level. When studying the overall productivity of an ecosystem, it should be remembered that the increase in secondary production always occurs not in parallel with the growth of primary, but due to the destruction of some part of it. That is, there is a kind of withdrawal, subtraction of secondary products from the total amount of primary products. Therefore, ecosystem productivity is always assessed based on primary production. In general, secondary productivity ranges from 1 to 10%, and this in turn depends on the properties of the animals and the characteristics of the food or food eaten.
Related information.
The one percent rule. According to the one percent rule, a change in the energy of a natural system within 1% takes the natural system out of an equilibrium (quasi-stationary) state. All large-scale phenomena on the Earth's surface (powerful cyclones, volcanic eruptions, the process of global photosynthesis), as a rule, have a total energy that does not exceed 1% of the energy of solar radiation incident on the surface of our planet. The artificial introduction of energy into the biosphere should not exceed this limit. The transition of the process energy beyond this value (1%) usually leads to significant anomalies: sharp climatic deviations, changes in the nature of vegetation, large forest and steppe fires.
Ten percent rule (law of the energy pyramid). In accordance with the law of the energy pyramid, on average no more than 10% of energy moves from one trophic level of the ecological pyramid to another level.
Trophic level is the totality of all living organisms belonging to one link in the food chain. The first trophic level is always producers, creators of organic substances necessary for all living organisms. Herbivorous consumers (phytotrophs or phytophages) belong to the second trophic level; carnivores (predators), living off phytophages, belong to the third trophic level; those consuming other carnivores are accordingly classified as fourth, etc.
Green plants, consuming solar energy and inorganic substances from the external environment, form organic substances through photosynthesis, i.e. produce biological products, which are often called primary production or gross production of producers. Secondary products are biomass created by consumers.
In the process of their life, plants spend part of their primary production on respiration, on the formation of new cells and tissues, and on growth. If we subtract from primary production those products that producers spent for their needs, then the remaining part represents what is called “net production.” Net production is in the form of biomass and moves continuously from one trophic level to another. Pure primary production, captured by consumers in the form of food, is also spent by them on life processes and on the construction of secondary products, i.e. biomass of phytophages), and part returns to the abiatic environment in the form of excrement, secretions and corpses. In turn, approximately 10% of the biomass and energy stored in phytophages are transferred to the next level of consumers, ensuring their existence, diversity and abundance.
The law of the energy pyramid allows you to make calculations of the required land area to provide the population with food and other environmental and economic calculations.
The average maximum transfer of energy (or matter in energy terms) from one trophic level of the ecological pyramid to another is 10%, and can range from 7 to 17%. This value does not lead to adverse consequences for the ecosystem and therefore can be accepted as the norm for environmental management in human economic activity. Exceeding this value is unacceptable, since in this case complete disappearances of populations may occur. The law of the energy pyramid and the ten percent rule serve as a general limitation in the use of natural resources for human economic activity.
The rule of mandatory filling of ecological niches. An empty ecological niche is always naturally filled. An ecological niche as a functional place of a species in an ecosystem allows a form capable of developing adaptive characteristics to fill this niche, but sometimes this requires considerable time.
Note. A likely example of the rule for mandatory completion of environmental information is the emergence of new diseases, for example, AIDS (acquired immunodeficiency syndrome). It was hypothetically predicted more than 10 years before the disease was identified as an influenza-like virus with a high mortality rate. The basis for the prediction was that the victory over many human infectious diseases freed up ecological niches that inevitably had to be filled. Since during ecological duplication, as a rule, the change goes in the direction from larger and highly organized forms to smaller and more organized ones, it was assumed that one of the ecological niches would be filled precisely by a virus with a high degree of variability. Thus, the hypothesis was apparently justified.
The rule of inevitable chain reactions (“hard” control of nature). “Hard” technical management of natural systems and processes is fraught with natural chain reactions, a significant part of which is environmentally, socially and economically unacceptable over a long period of time. An example with the Aral disaster. The transfer of water from northern rivers would lead to undesirable environmental effects (flooding of a huge area of land, destruction of forest, oil, gas fields, etc.)
The rule of “soft” management of nature.“Soft” (indirect) control of nature causes chain reactions desirable for humans.
“Soft” control is more preferable than a “hard” technogenic solution, despite the high initial costs. This is the rule for the expedient transformation of nature. In contrast to “hard” management (see the Rule of chain reactions under “hard” management), “soft” management, based on restoring the former natural productivity of ecosystems or increasing it through a purposeful series of events based on the use of objective laws of nature, makes it possible to direct natural chain reactions reactions in a direction favorable for the economy and people’s lives. An example is a comparison of two forms of forestry management - clear-cutting (“hard” impact) and selective logging (“soft” impact). Clear cutting, in which all the wood is taken in one go, is considered economically more profitable. When selective cutting occurs, many technical complications arise, and therefore the cost of wood harvesting turns out to be more expensive. It is assumed that in clear cutting areas the forest can and should be restored by mass planting (and this activity is generally inexpensive). However, with clear cuttings, the forest environment itself is gradually lost, which leads to a drop in river levels, in other places - to waterlogging, overgrowing of the cutting area with non-forest plant species, preventing forest growth, the emergence of breeding grounds for forest pests, and other adverse consequences. The lower initial costs of a “hard” event give rise to a chain of damages, which then require large expenses for their elimination. On the contrary, with selective logging, forest restoration is facilitated due to the preservation of the forest environment. The increased initial costs are gradually recouped by preventing environmental damage.
The transition from “soft” to “hard” management is advisable only with the simultaneous replacement of extensive forms of farming with extremely intensive ones and, as a rule, within relatively short time intervals. In the long term, only “soft” control of natural processes is effective. See also Principles of Nature Transformation.
The rule is “environmentally-economical”. Economics and ecology cannot be opposed. You cannot slow down the pace of industrialization - this will mean a kind of economic utopianism, just as you cannot reduce your efforts in the field of ecology - this will mean environmental extremism. The solution to the issue lies somewhere in the middle.
Integral resource rule. Competing in the field of use specific natural systems of economic sectors inevitably cause damage to each other the more strongly, the more significantly they change the jointly exploited environmental component or all ecosystem generally. For example, in the water sector, hydropower, transport, public utilities, irrigated agriculture and the fishing industry are interconnected in such a way that fisheries are in the least advantageous position. The more complete the hydropower use of water, the more difficult it is to manage other sectors of the water economy: the development of water transport complicates other ways of using water, and irrigation causes difficulties in related forms of water exploitation.
Demographic saturation rule. In a global or regionally isolated population, the population size corresponds to the maximum ability to support its life activity, including all aspects of existing human needs.
In essence, this rule states that humans, like any other biological species, will increase their numbers to the maximum possible size, which is determined by the capacity of the environment, and no more. However, humanity creates pressure on the environment not so much biologically as technogenically. In fact, what is now observed in the world is not demographic saturation, taking into account all human needs, but technical oversaturation. Failure to comply with the rule of demographic saturation results in a sharp imbalance in the system of relationships between man and nature. Theoretically, a situation is possible when limiting mechanisms are implemented and a demographic catastrophe occurs (a sharp decline in the human population).


